Commercial Rooftop Solar System: In 2025, India stands at a decisive moment in its renewable energy journey. As power tariffs for commercial users continue to rise and solar technology becomes more affordable, rooftop solar systems are emerging as one of the most attractive investments for businesses.
The central question most companies now ask is simple:
“How fast will my rooftop solar system pay back its cost?”
The answer depends on several variables—installation cost, energy yield, state policies, electricity tariff, and maintenance expenses. But in today’s market, with falling solar prices and favorable net-metering regulations, most commercial solar installations achieve payback within 2–4 years — and then produce free power for over two decades.
This article provides a complete, research-based, and easy-to-follow guide to understanding commercial rooftop solar payback in India for 2025. We’ll cover cost structures, government policies, state-wise examples, financial benefits, and future projections—all written for real business decision-makers, not engineers.
1. Understanding Rooftop Solar Payback
The payback period is the time it takes for the savings generated by your solar system to equal its total installation cost (CAPEX). Once the system pays for itself, all further electricity generation effectively becomes profit.
Simple Payback Formula:
Payback (years) = Total Cost / (Annual Savings – Annual O&M)
Where:
- Total Cost (CAPEX) = Installation cost per kW × total kW installed
- Annual Savings = Electricity tariff × annual solar generation
- Annual O&M = 1% of CAPEX (average for rooftop systems)
Key Factors That Determine Payback
- System Cost (₹/kW) – varies by scale and quality.
- Specific Yield (kWh/kWp/year) – depends on sunlight hours.
- Electricity Tariff (₹/kWh) – your grid rate determines savings.
- Net-Metering Policy – how the grid credits your solar exports.
- Maintenance and Financing – small costs but affect ROI slightly.
2. Commercial Rooftop Solar Costs in 2025
Due to advances in module technology, domestic manufacturing, and large-scale production under India’s PLI (Production Linked Incentive) scheme, solar prices have fallen significantly in the last few years.
| Project Scale | Typical Cost (₹/kW) | Description |
| 25–50 kW | ₹45,000–₹60,000 | Small commercial units, shops, schools |
| 100–250 kW | ₹38,000–₹48,000 | Mid-size industries, hotels |
| 500 kW and above | ₹33,000–₹40,000 | Large industries, warehouses |
Average decline: Over 30% since 2021, mainly due to cheaper modules (TOPCon, HJT, bifacial panels) and domestic inverter production.
For our calculations, we’ll assume a specific yield of 1,500 kWh per kW per year, which represents average solar conditions across India.
3. Example Payback Calculations (2025)
Let’s look at three real-world scenarios.
A. Small Commercial Unit – 50 kW Rooftop
- CAPEX: ₹40,000/kW × 50 = ₹20,00,000
- Annual Generation: 1,500 × 50 = 75,000 kWh
- Electricity Tariff: ₹10/kWh
- Savings: ₹7,50,000/year
- O&M: ₹20,000/year
Net Annual Benefit: ₹7,30,000
Payback: ₹20,00,000 / ₹7,30,000 = 2.7 years
B. Medium-Scale Business – 200 kW Rooftop
- CAPEX: ₹42,000/kW × 200 = ₹84,00,000
- Generation: 300,000 kWh/year
- Tariff: ₹9/kWh
- Savings: ₹27,00,000/year
- O&M: ₹84,000/year
Net Benefit: ₹26,16,000
Payback: ₹84,00,000 / ₹26,16,000 ≈ 3.2 years
C. Large Industrial Rooftop – 500 kW
- CAPEX: ₹35,000/kW × 500 = ₹1.75 crore
- Generation: 750,000 kWh/year
- Tariff: ₹11/kWh
- Savings: ₹82,50,000/year
- O&M: ₹1,75,000/year
Net Benefit: ₹80,75,000
Payback: ₹1.75 crore / ₹80.75 lakh = 2.17 years
Insight:
Larger installations achieve faster paybacks due to lower cost per kW and economies of scale.
4. State-Wise Solar Payback in India (2025)
Different states experience different solar irradiance levels and tariff structures, leading to varied payback durations.
| State | Avg. Irradiation (kWh/kWp/yr) | Avg. Tariff (₹/kWh) | Typical Payback |
| Gujarat | 1,800 | 9.0 | 2.0–2.5 years |
| Rajasthan | 1,850 | 8.5 | 2.2–2.8 years |
| Maharashtra | 1,650 | 9.5 | 2.5–3.0 years |
| Karnataka | 1,700 | 9.0 | 2.5–3.2 years |
| Delhi | 1,550 | 10.5 | 2.5–3.0 years |
| Punjab | 1,500 | 11.0 | 2.3–3.0 years |
| Tamil Nadu | 1,700 | 8.5 | 2.5–3.4 years |
| West Bengal | 1,450 | 8.0 | 3.5–4.5 years |
| Assam | 1,300 | 7.5 | 4.0–5.0 years |
Observation: Western and Northern India offer the fastest solar paybacks thanks to abundant sunlight and higher commercial tariffs.
5. Government Incentives and Tax Benefits
A. Accelerated Depreciation (AD)
Commercial entities can claim 40% depreciation in the first year on solar equipment, reducing taxable income and improving net ROI.
Example:
If your system costs ₹1 crore → ₹40 lakh depreciation.
Assuming 25% tax rate → ₹10 lakh saved → Payback improves by ~6 months.
B. GST Input Credit
Businesses registered under GST can claim input tax credit on the GST paid for solar components (13.8% typically).
This effectively reduces overall CAPEX by 8–10%, accelerating payback.
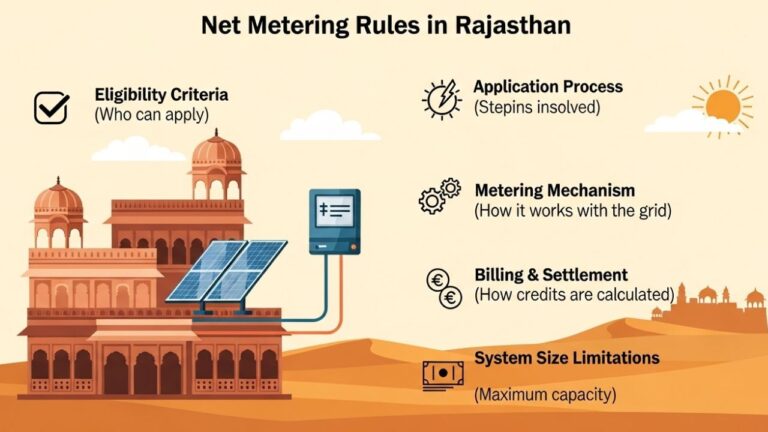
C. Net Metering & Group Net Metering
As of 2025, most states allow net or group net metering for commercial setups:
- Net Metering: Offset exported power against imports.
- Group Net Metering: Combine multiple premises under one billing account.
This ensures optimal use of generated solar energy and minimizes wastage.
D. Renewable Purchase Obligation (RPO) Benefits
Industries under RPO mandates can meet part of their renewable target through captive rooftop installations, avoiding penalties and improving sustainability scores.
6. Additional Financial Gains
Beyond electricity savings, rooftop solar delivers hidden financial and strategic benefits:
| Benefit | Description |
| Reduced Peak Demand Charges | Offsets high-tariff daytime loads, avoiding demand penalties. |
| Better ESG Ratings | Improves environmental credentials for investors and clients. |
| Carbon Credit Income | Each MWh of solar = ~1 carbon credit; tradable value ₹700–₹1,000 per credit. |
| Brand Reputation | Positions company as a sustainability leader. |
| Energy Independence | Less reliance on unstable grid tariffs or outages. |
7. Real-World Case Studies
Case 1: Textile Mill in Surat, Gujarat
- System Size: 400 kW
- CAPEX: ₹36,000/kW = ₹1.44 crore
- Generation: 720,000 kWh/year
- Tariff: ₹9.5/kWh → ₹68.4 lakh/year savings
- Payback: 1.44 crore / 68.4 lakh = 2.1 years
After accounting for tax benefits and depreciation, the net effective payback drops to 1.6 years.
Case 2: Educational Institution in Delhi
- System Size: 100 kW
- CAPEX: ₹45,000/kW = ₹45 lakh
- Generation: 150,000 kWh/year
- Tariff: ₹10.5/kWh → ₹15.75 lakh/year
- Payback: 45 / 15.75 = 2.85 years
Case 3: Food Processing Unit in Punjab
- System Size: 250 kW
- CAPEX: ₹42,000/kW = ₹1.05 crore
- Generation: 375,000 kWh/year
- Tariff: ₹11/kWh → ₹41.25 lakh/year
- Payback: 1.05 crore / 41.25 lakh = 2.54 years
8. Long-Term ROI and Internal Rate of Return (IRR)
While payback gives a quick snapshot, IRR offers a deeper measure of profitability over the project’s life.
| System Size | Payback (yrs) | Expected IRR (Post-Tax) |
| 50 kW | 3.0 | 22–25% |
| 200 kW | 2.8 | 24–27% |
| 500 kW | 2.3 | 26–30% |
After 25 years of operation, businesses typically save 10–12 times the initial investment.
9. Environmental Impact
Beyond economics, solar power contributes immensely to India’s carbon reduction goals.
A 500 kW rooftop system producing 750,000 kWh/year prevents:
- ~750 tons of CO₂ emissions annually, equal to planting 12,000 trees every year.
For corporates with ESG mandates, this environmental dividend enhances both brand equity and compliance.
10. Future Outlook: 2025–2030
India’s solar mission aims for 280 GW of solar capacity by 2030, of which 40 GW will come from rooftops.
Between 2025 and 2030, expect:
- Further cost drops (20–30%) due to large-scale domestic module production.
- Increased efficiency with bifacial and N-type cells achieving >23% efficiency.
- Digital performance monitoring using AI for predictive maintenance.
- Integration with EV charging and battery storage for energy independence.
- Peer-to-peer solar trading through blockchain-based platforms.
Result: by 2030, payback for large commercial rooftops could shrink to under 2 years.
11. Challenges and How to Overcome Them
| Challenge | Impact | Practical Solution |
| Policy Variability | Different states have different metering rules | Work with MNRE-registered EPC contractors familiar with local policies |
| Roof Strength | May not support full load | Conduct a structural audit and use lightweight or ballasted mounts |
| Dust & Pollution | Reduces panel output | Adopt automated cleaning and regular maintenance |
| Initial CAPEX | Upfront investment hurdle | Use RESCO/lease or solar financing models |
| Bureaucratic Delays | Slow approvals in some states | Engage early with DISCOM and local nodal agencies |
12. Step-by-Step Payback Estimation for Your Business
- Assess Roof Area: ~10 sq. meters per kW.
- Decide Capacity: (Example: 500 sq. meters = 50 kW).
- Estimate Generation: 1,500 × system size (kWh/year).
- Calculate Annual Savings: Generation × tariff.
- Deduct O&M: 1% of CAPEX.
- Compute Payback: CAPEX ÷ (Annual Savings − O&M).
Example:
- 100 kW system @ ₹45,000/kW → CAPEX ₹45 lakh
- Generation = 150,000 kWh
- Tariff = ₹10
- Savings = ₹15 lakh
- O&M = ₹45,000
✅ Payback = 45 / (15 − 0.45) = 3.1 years
13. Frequently Asked Questions (FAQs)
Q1. Do commercial rooftops get subsidies?
Central subsidies are mainly for residential use, but many states offer generation-based incentives or tax rebates for commercial entities.
Q2. What is the life span of a solar system?
Panels: 25–30 years; Inverters: 8–12 years (replace once).
Q3. How often should cleaning and maintenance occur?
Typically once every 10–15 days in dusty areas, monthly in others.
Q4. Can excess solar power be sold back to the grid?
Yes, through net metering. You earn credits for exporting energy, adjusted in your next bill.
Q5. Is financing available for rooftop solar?
Yes. Banks, NBFCs, and green funds offer solar loans with 8–10% interest and up to 7-year tenure.
14. Why 2025 Is the Perfect Year to Invest in Rooftop Solar
The commercial solar market in 2025 offers a unique alignment of low costs, high tariffs, and strong policy support.
- Module prices are at record lows.
- Electricity tariffs continue to rise 4–6% annually.
- Financing and leasing models are abundant.
- Regulatory processes are smoother than ever.
In essence, rooftop solar today is not just an environmental choice—it’s a business strategy for cost reduction and resilience.
Conclusion
The era of affordable, high-return solar energy has arrived in India. For commercial and industrial users in 2025, rooftop solar systems typically deliver payback within 2 to 4 years, depending on scale and state. Beyond that, they continue producing free electricity for more than two decades.
With accelerated depreciation, tax credits, and tariff savings, the true IRR often exceeds 25%, outpacing most traditional investments. As solar technology advances, businesses adopting it now will not only enjoy financial freedom from rising energy costs but also position themselves as sustainability leaders in a carbon-conscious economy.
So, whether you manage a factory, a mall, or an office complex — 2025 is the year to switch to commercial rooftop solar and let the sun power your profits.
Related Posts

33 thoughts on “Commercial Rooftop Solar System Payback in India 2025: A Complete Guide for Businesses”